The Pew Research Center released one of the largest political studies in its history last week, which we were pleased to help support. Its findings, when coupled with longitudinal data from Pew surveys over the last two decades, reveal a complex picture of what is, and what is not, changing in the American electorate.
Some context: since 1987, Pew has conducted a periodic “Political Typology” survey exploring the causes, consequences, and extent of variations in American political values. Over its 20-year history, this study has surveyed the political beliefs and values of about 3,000 Americans, allowing for very useful insights about the country at large, but less nuanced understanding of how these values vary by age, geography, race or ethnicity, level of political engagement, or socio-demographic background. With this poll Pew has expanded this survey to include 10,000 respondents—enough to help us understand the many, many different flavors of American political opinions and values. It reveals an American public that is far more nuanced than our party structure allows for—some are very liberal, some are very conservative, but the vast majority (79%) doesn’t consistently fall within either of these camps.
Let me share a few of the insights I have gleaned from the expanded typology data thus far:
- “Overall, 21% of Americans today are consistently liberal or conservative in their political views, up from 10% in 1994.”
- The partisan gap in opinions on more than 40 separate political topics (including the environment, immigration, and the role of government) has doubled over the previous quarter century.
- People don’t just disagree more, they also like each other less. “Levels of partisan animosity—holding a very unfavorable view of the other political party—have more than doubled over the past two decades….Today 38% of Democrats hold a very unfavorable view of the Republican Party, and 43% of Republicans say the same about the Democratic Party. Those figures were 16% and 17%, respectively, in 1994…”
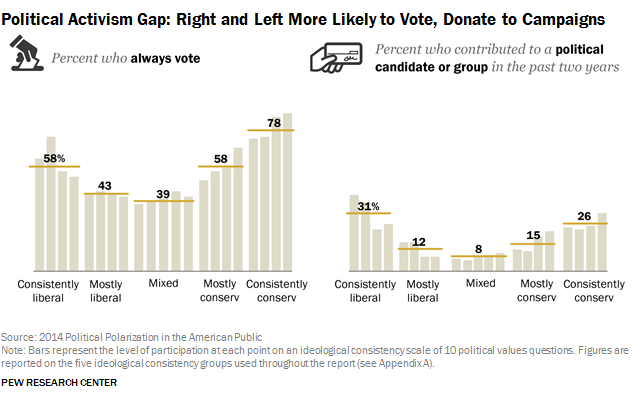
- And it is those who disagree more (and like the other side less) that increasingly dominate our politics: Of the most consistently conservative Americans, 80% say they “always vote”. Of the most consistently liberal, 61%. Contrast this with moderate turnout around 40%, and we have a problem…
I love data. Even somewhat depressing data like these. And the data don’t stop here. The findings are so robust that they cannot all be discussed in one release (much less one blog post). So Pew will be releasing findings on a rolling basis over the next six months, and I imagine we that we at Hewlett will continue to blog about it. The series will soon look more closely at the relationship between polarization and media consumption, social networks, exposure to political messaging, geographic location, and economic status, amongst other things. This has given us much to think about. I hope that others are likewise inclined to wrestle with these data, their implications for our democracy, and what we can do to improve the American political landscape moving forward.